Comparing Loop with?

.avif)

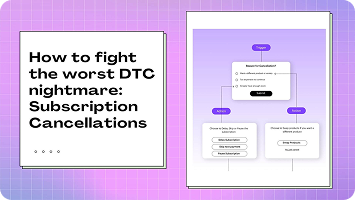
They subscribed. They loved your product. Then somewhere between order three and order four—they disappeared.
You didn't see it coming. Neither did your analytics.
This is the silent killer of subscription businesses: churn that happens in the blind spots. No warning signs. No exit surveys. Just subscribers quietly canceling while your dashboard shows "healthy" top-line metrics.
Most subscription brands are flying blind. They track revenue and count active subscriptions. But they have no idea why people stay—or when they're about to leave.
The best subscription app doesn't just track numbers—it surfaces actionable insights. It shows you what's actually happening inside your subscriber base, why it's happening, and what to do about it.
That's the difference between basic reporting and real analytics.
Vanity metrics tell you what happened: total subscribers, monthly revenue, order count. Useful for board decks. Useless for decision-making.
Actionable analytics tell you why it happened and what's coming next: which cohorts retain best, where subscribers drop off, which products drive loyalty versus one-time purchases.
The most common mistake? Treating aggregate numbers as insights.
A brand might celebrate 1,000 new subscribers while missing that 400 of them will cancel before their third order—because their analytics never showed the pattern.
The opportunity isn't just tracking numbers—it's understanding the story behind them.
Here's what makes Loop the best Shopify subscription app for subscription analytics—and why brands like OSEA Malibu, Lumin, and NutriPaw are seeing results basic reporting can't deliver.
Before you can reduce churn, you need to understand who's subscribing in the first place.
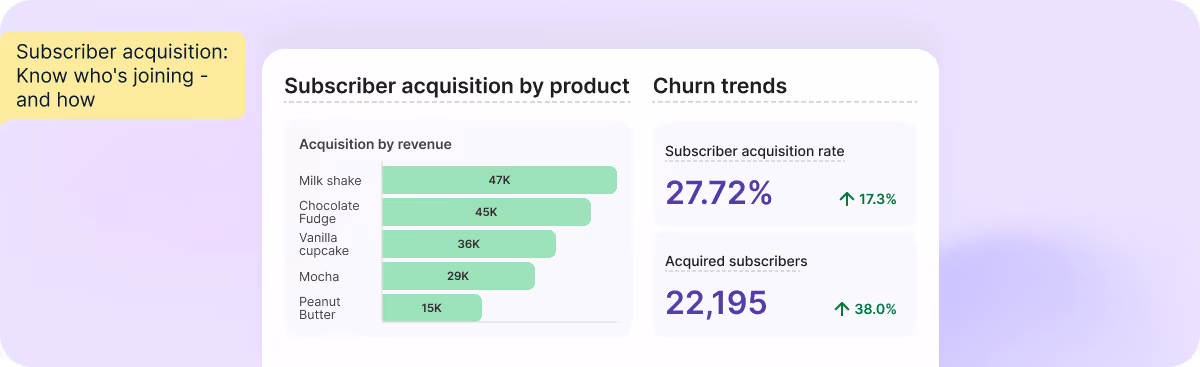
Here's what you need to see:
What the numbers mean: If your 14-day delivery option has 3x higher churn than your 30-day option, you don't have a retention problem—you have a frequency problem baked into acquisition. You're setting subscribers up to fail before they even start.
What to do about it: Adjust your default frequency, reposition your cadence options, or add guidance at checkout about which frequency works best for different use cases.
Most platforms show you current subscriber count. Loop shows you how subscribers behave over time—by cohort.
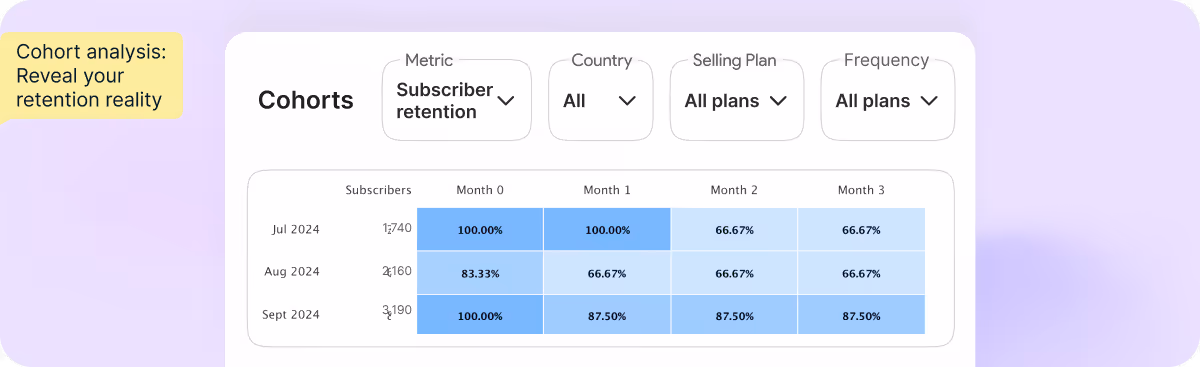
Here's what you need to see:
What the numbers mean: Aggregate retention rates hide critical patterns. Your January cohort might retain at 80% while your March cohort bleeds subscribers after week two. Without cohort-level visibility, you'd never know that your March acquisition campaign attracted the wrong audience—or that a product change alienated new subscribers.
What to do about it: Double down on channels and campaigns that produce high-retention cohorts. Investigate what changed during low-retention periods—pricing, creative, product mix—and course-correct.
OSEA Malibu used cohort insights to identify that subscribers canceling after their second order behaved differently than those canceling after their tenth. By creating segmented retention strategies for each cohort, they reduced churn from 10% to 5%—cutting it in half within six months.
Orders are where subscriptions succeed or fail. Loop tracks the full lifecycle—scheduled, rescheduled, paused, cancelled, attempted, successful, failed, and recovered.
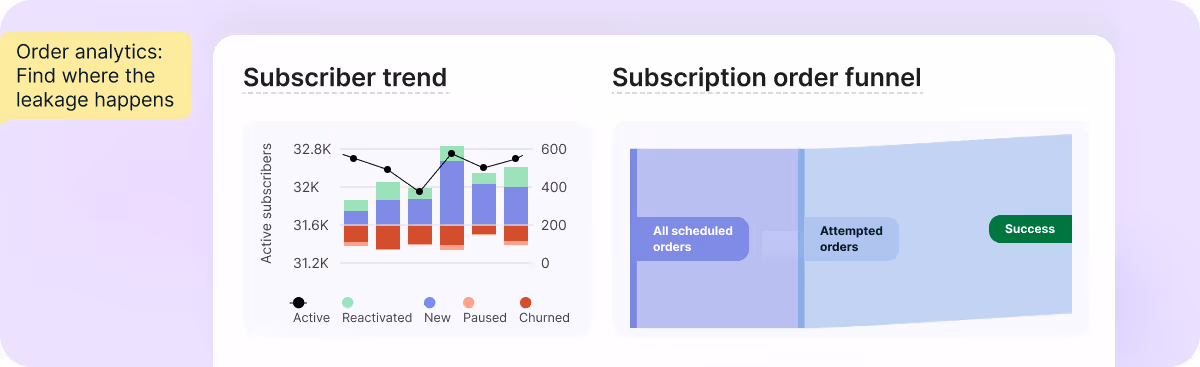
Here's what you need to see:
What the numbers mean: If 15% of your scheduled orders get cancelled before they're even attempted, you have an upstream problem—timing, communication, or product fit. If order #3 has a 25% higher cancellation rate than order #2, that's exactly where your retention efforts should focus.
What to do about it: Build retention touchpoints around high-risk order numbers. If order 3 is your drop-off point, trigger personalized outreach after order 2—a thank-you note, a usage tip, or an offer to adjust frequency. Loop Flows makes this automation simple.
Failed payments cause 20-40% of all subscription churn. Loop's smart dunning management turns reactive recovery into proactive prevention.
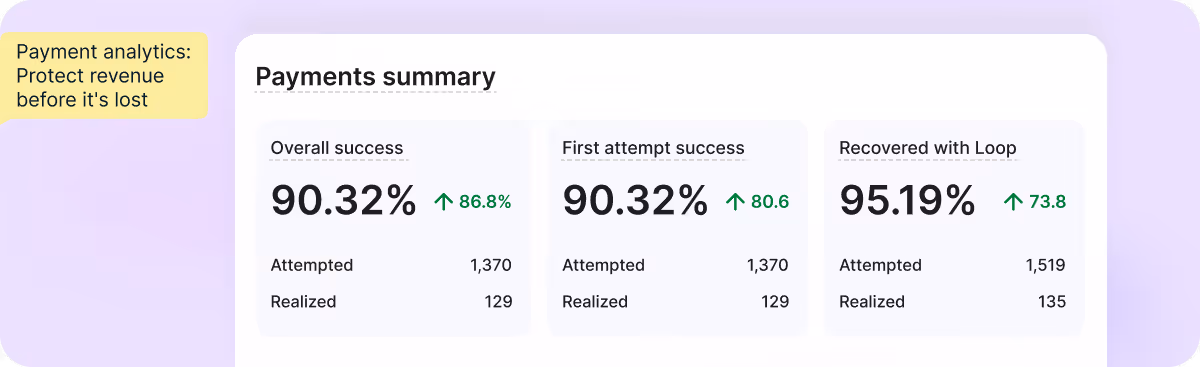
Here's what you need to see:
What the numbers mean: If payments are failing at higher rates with one provider, that's a payment stack problem, not a subscriber problem. If your backup card save rate is low, you're losing revenue that better payment infrastructure could capture.
What to do about it: Optimize retry timing based on what's actually working. Proactively reach out to subscribers with expiring cards before the next billing cycle. Consider adding payment methods that perform better for your customer base.
Lumin Skincare used Loop's payment analytics to optimize retry timing, contributing over 12% to their quarterly subscription revenue.
Different products retain differently. Each SKU in your catalog has its own retention fingerprint.
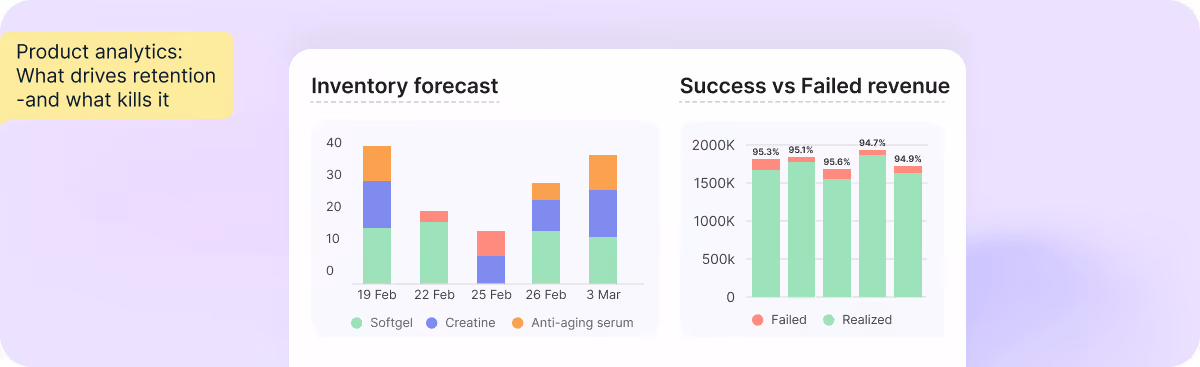
Here's what you need to see:
What the numbers mean: A coffee subscription might see 90% retention on their signature blend but 60% on their experimental roasts. Without product-level analytics, you'd see "75% retention" and miss that one SKU is dragging down your entire program.
What to do about it: Make your highest-retention products your acquisition bait. Scrutinize high-churn products for improvement—or removal. For inventory, adjust orders based on dunning status: if 80 of your 500 scheduled units are tied to failed payments, you might only need 420.
Upsells are one of the fastest paths to revenue growth from existing subscribers. But without tracking, you're guessing.
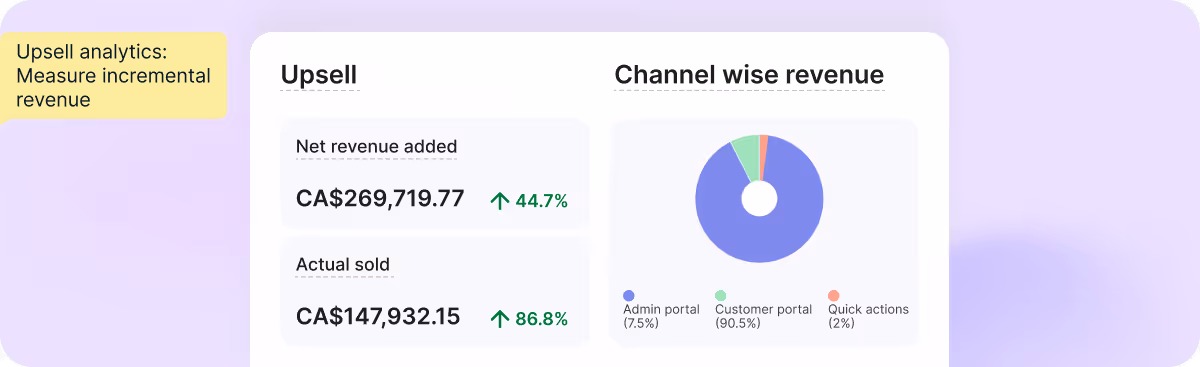
Here's what you need to see:
What the numbers mean: If upsells are contributing 3% of revenue but you're showing offers to every subscriber, you have a targeting problem. The right offer to the wrong segment is just noise.
What to do about it: Analyze which product recommendations resonate with different subscriber segments. Double down on what converts; cut what doesn't.
OSEA Malibu grew upsell revenue contribution from 4.5% to 6.8% by matching recommendations to subscriber behavior patterns.
When a subscriber clicks "Cancel subscription," most platforms record a number. Loop's cancellation flows record the full picture.
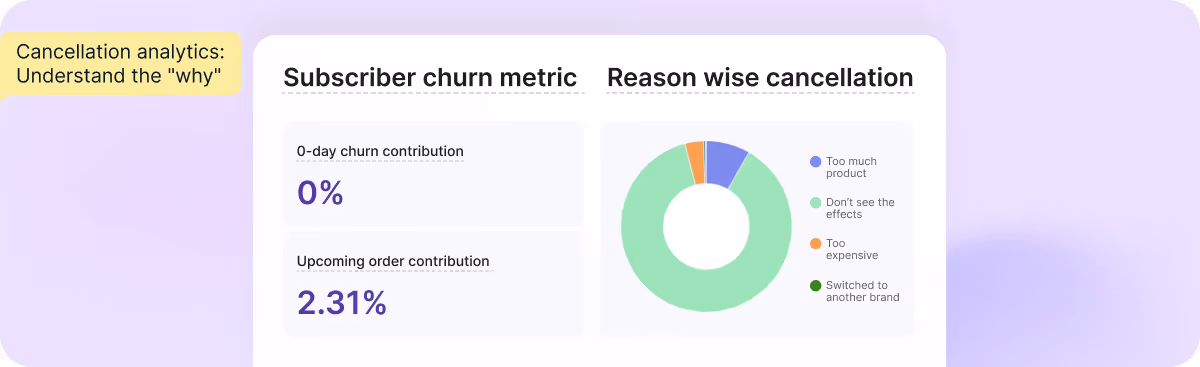
Here's what you need to see:
What the numbers mean: If your 0-day churn is high, you don't have a retention problem—you have an acquisition problem. You're bringing in discount hunters with no intent to continue. If 40% of cancellations happen after order two and the primary reason is "too much product," you have a frequency problem, not a loyalty problem.
What to do about it: Address causes, not symptoms. High 0-day churn? Tighten acquisition targeting or adjust your intro offer. High "too much product" cancellations? Offer frequency adjustments proactively, before they hit the cancel button.
Loop also tracks save rates at each stage of your cancellation flow—benefits, reasons, and offers—so you know exactly where your retention efforts are working and where they're falling flat.
Predicting subscription revenue sounds simple: multiply subscribers by price. In practice, it's far more complex.
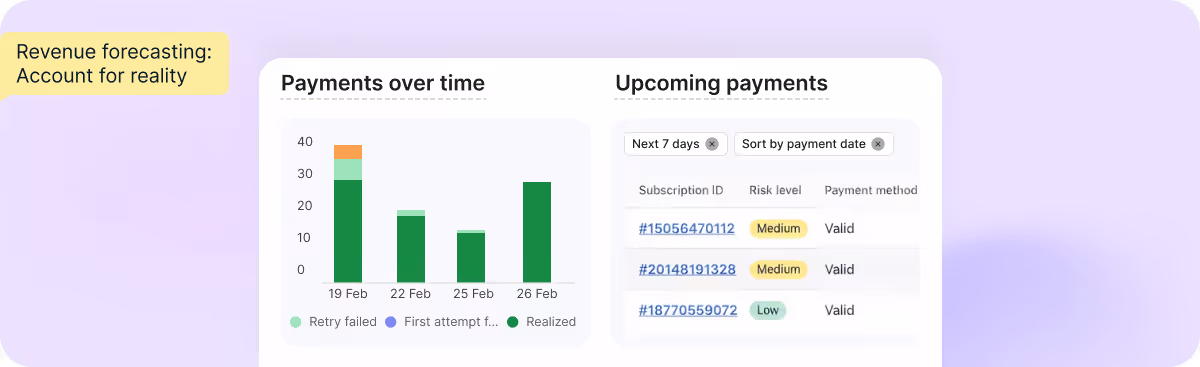
Here's what you need to see:
What the numbers mean: Your "expected" revenue isn't what you'll actually collect. If your last billing cycle recovered 70% of failed payments, you can project that recovery rate forward—and plan accordingly.
What to do about it: Use historical recovery rates to set realistic revenue expectations. Identify at-risk revenue early and prioritize proactive dunning for high-value subscriptions.
Loop's analytics capabilities consistently earn praise from Shopify merchants. Here's what brands are saying on the Shopify App Store:
.png)
.png)
.png)
With a 5.0 rating across 560+ reviews, Loop is recognized as a leading Shopify subscription app—and analytics is a key reason why.
Subscription analytics doesn't have to be a mystery. With the right infrastructure, your data becomes a roadmap—showing exactly where to invest, what to fix, and which subscribers need attention before they leave.
Book a demo to see how Loop's subscription analytics can transform your business intelligence—or start your free trial to experience it firsthand.
Your subscribers are telling you a story. It's time to listen.